(Last updated June 2020)
Previewing the A2J Guided Interview® is an essential function of authoring. It is important to “see” what the end-user will see before it is finally uploaded and published over the web. For instance, while authoring an A2J Guided Interview, you may find, after previewing it, that you have added too much information in a single Question clearer for the end user.
Finally, by previewing, you can troubleshoot the A2J Guided Interview. You can determine whether Questions are flowing properly and whether information is being properly collected through the use of the variables and conditions you have written into each Question.
This chapter will explain how to enter Preview Mode, conduct a simple preview, and use the Preview Mode toolbox to troubleshoot the A2J Guided Interview.
Entering Preview Mode
You can reach the Preview Mode in two ways. First, you can select the “Preview” Tab from the navigation buttons on the left side of the screen. The Preview of the A2J Guided Interview will begin with the first question of the interview (see first figure below). You can also Preview by selecting the “Preview” button from within the Question Design Editor when editing a particular Question (see second figure below). This route allows you to Preview the A2J Guided Interview, beginning with the Question which you are currently editing. Both ways take you into the A2J Viewer and allow you to see a version of the Guided Interview like an end user would see it.

Figure: Preview Mode from the Introductory Question.
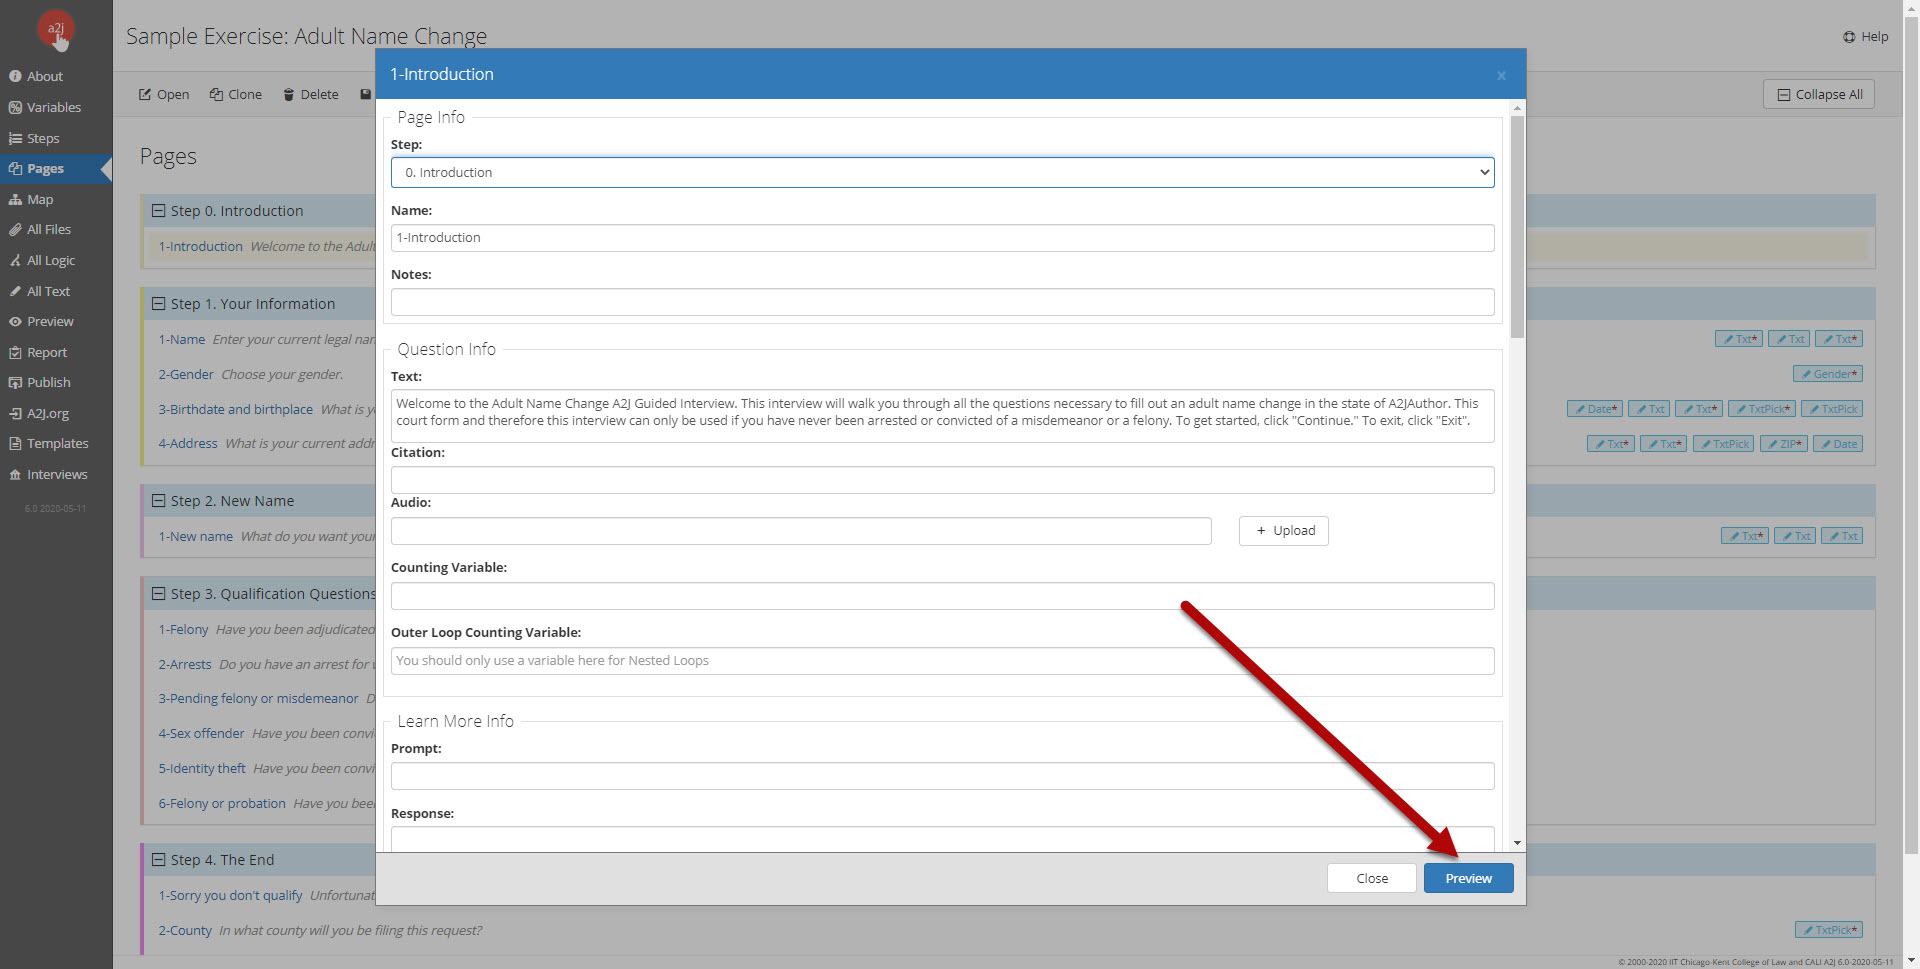
Figure: The Preview button in the Question Design Editor.
Once in Preview Mode you will see the A2J Guided Interview interface and a Preview Mode debug panel (figure below). To return to the Question Design Editor for the current question, select “Edit This.” To return to the Question Design Editor for the question where you began your preview session, select the “Resume Edit” button.
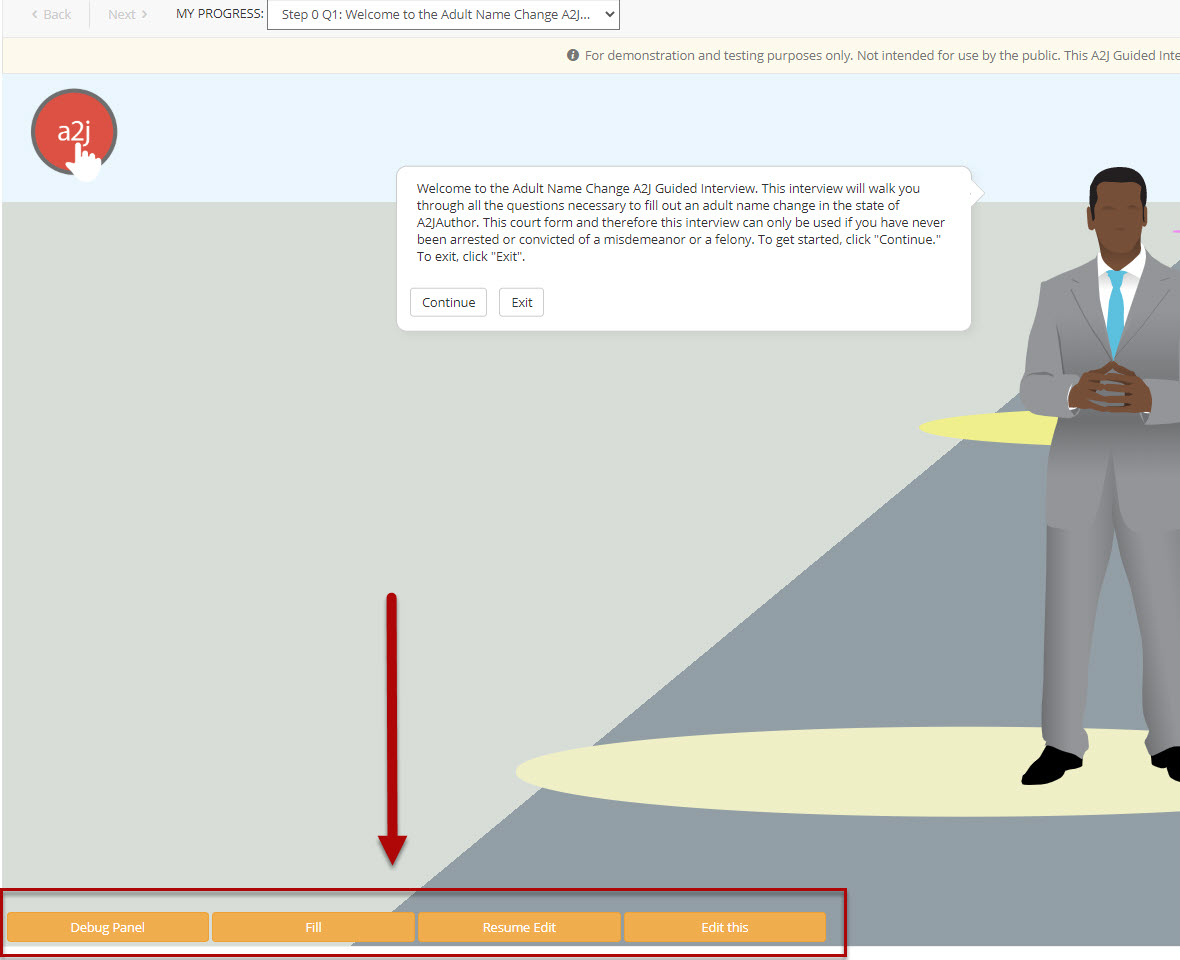
Figure: Preview Mode with the Debug Panel highlighted.
Simple Preview for Formatting and Content
A simple preview of a Question allows you the opportunity to test a number of formatting concerns. Here is a list of items that can be checked while conducting a simple preview of a question:
-
BUTTONS: Does the button work properly? Does the question connect to the intended question? Even if the button works properly, does the flow make sense to the end-user? Is it logical?
-
REQUIRED FIELDS: Are all of the required fields programmed as “user must fill in”? Can a user move on without answering a question you thought was required?
-
FORMATTING: Is the formatting of the text in the question, pop-ups, and Learn More clear? Is it too verbose?
-
HYPERLINKS: If there are hyperlinks, do they work? Should more words be included in the hyperlinked phrase to ensure the end-user will not have trouble selecting the link?
Previewing to Troubleshoot
The Debug panel is available in Preview Mode. It lets you open the Scripting Window and the Variables List.

Figure : Debug Panel
The Debug Panel contains two components: the list of variables and the scripting sitting behind the A2J Guided Interview as it runs in the A2J Viewer.
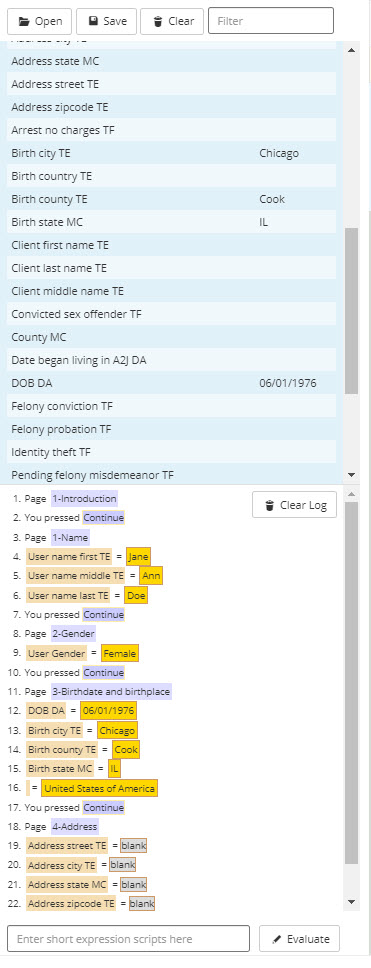
Figure: The Variables List and Scripting Box in the Debug Panel.
The list of variables is at the top of the Debug Panel. It contains the names of each variable and its value as it is collected during the preview of the A2J Guided Interview. In the event you test a repeat dialog, the window will show, under the “Loop” heading, how many times you have repeated a loop. For instance, if you repeated a loop two times to collect names of children, the list would show the variable “Child name TE” two times in the Variables list, with a 1 and 2 listed in the adjacent Loop column, respectively (see figure below).
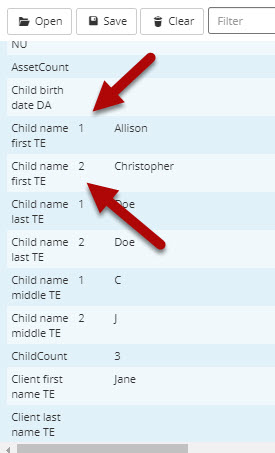
Figure: The Variables List within the Debug Panel showing a repeating variable with multiple values.
Testing and retesting is made easier by the open, save, and clear buttons and the filter box, all located at the top of the Variables List in the Debug Panel (figure below).
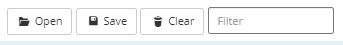
Figure: Variable List buttons within the Debug Panel.
Using the “Clear” button with the trash can icon, you can retest a question with new data. If you do not have time to finish testing an A2J Guided Interview, the collected variable values can be saved, by selecting the “Save” button (figure above). To resume testing, enter Preview Mode using the Question Design Editor for the last Question tested. Once in Preview Mode you can open a previously saved answer file by using the “Open” button (figure above). The saved answer file, in .anx file format, can also be used for testing with an A2J DAT Template or a HotDocs template. To learn more about testing your A2J Guided Interview and HotDocs template together, see Chapter 12. The Filter box allows you to sort your variable list. As you start to type into the box next to “Filter”, A2J Author will automatically filter your variable list by the characters that you have typed in (gif below).
Figure: Example of filtering by “Cli” to search for all variables referring to the “Client”
The Variables List in the Debug Panel is very helpful in troubleshooting because it tells you immediately if you have failed to assign a variable to a field. If no value is reflected in the Variables List in the TDebug Panel after completing the question being tested, then you know you have to check the Question for a variable.
The second component in the Debug Panel is the Script. It allows you to inspect how A2J Author® is treating each action associated with a question (figure below).
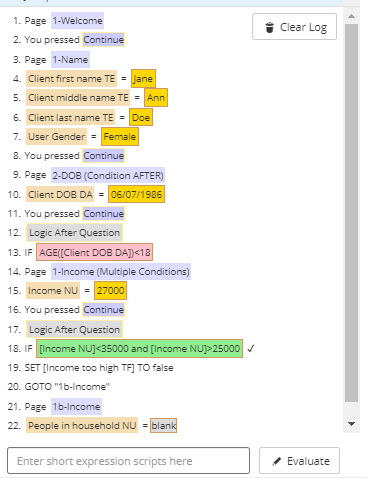
Figure: The Script Window.
The Script window will show you a log of your progression through the interview: what pages have been visited, what values have been assigned to what variables, and what logic statements have been evaluate.
For example, in the figure above, on lines 17-20 a logic statement was run after the user pressed the button (AFTER logic). It tested whether the user's income, which was set in line 15, is between $35,000 and $25000. The user's income was 27000 which falls between that given range, so the condition evaluated as true. It shows as green in the Script window when the condition is true. Because the condition is true, the variable [Income too high TF] was set to false. The second part of the logic statement had the user branched to the question 1b-Income.
Similar to the Variables List you will find a "clear" button located at the top of the Script window, represented by a trash can icon and the words “Clear Log”. Using the “Clear Log” button removes the actions you have already tested from the scripting window so that you can easily test and retest a question with new data.
The Script window will also show the evaluation of every advanced condition contained within that question. More specifically, a condition is shown in green if the condition evaluates as true. When a condition evaluates as true, the Script window will also show how A2J Author® handled the actions conditioned on the advanced condition script.
If the conditioned action is to set the value of another variable, the window will show that is has “SET” a variable's value according to the advanced condition scripting. As multiple values for multiple variables can be set off of one condition, it is possible to see a number of “SET” statements following a true (green) condition statement. If the conditioned action is to alter the destination question at that point in the interview, the window will show that the interview will “GOTO” the question designated in the advanced condition scripting. In other words, this window lets you know what A2J Author® is “thinking.”
Script Decoder
In the chart below you will find a description of each type of colored text in the Script window and what it represents. In addition, the chart provides a definition of the action commands “SET” and “GOTO.”
|
Interview Script Decoder |
|
|
Purple text |
Represents what button or Page was selected. The statement is prefaced by the words “You pressed" or "Page" |
|
Tan text |
Variables for which the question is collecting values in any type of field, text, number, radio buttons, checkboxes, etc. If it appears underneath an advanced condition statement, then the variable is being set as a result of the condition. |
|
Green text |
Advanced condition evaluation. If the advanced condition is in green, it represents that the condition is true. Any actions set as a result of the condition, either to “SET” a variable or to “GOTO” another question, will be reflected below the condition. |
|
Red text |
Advanced condition evaluation. If the advanced condition is in red, it represents that the condition is false. Any actions set as a result of the condition being false, either to “SET” a variable or to “GOTO” another question, will be reflected below the condition. |
|
“SET” |
The word “SET” shows what variable is being set with a predetermined value as a result of a condition. |
|
“GOTO” |
The word “GOTO” shows what destination question the current question is being directed to as a result of a condition. |